
Fig. 1.
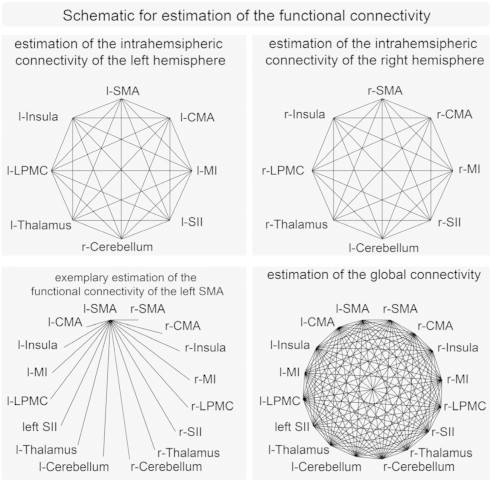
Schematic for estimation of the functional connectivity. The upper left panel shows the connections used to estimate the intrahemispheric connectivity of the left hemisphere, the upper right shows the connections used to estimate the intrahemispheric connectivity of the right hemisphere. The lower left panel shows (exemplary for the left SMA) the connections used to estimate the functional connectivity of one specific area. The lower right panel shows the connections used to estimate the global connectivity (l left, r right).