
Fig. 3.
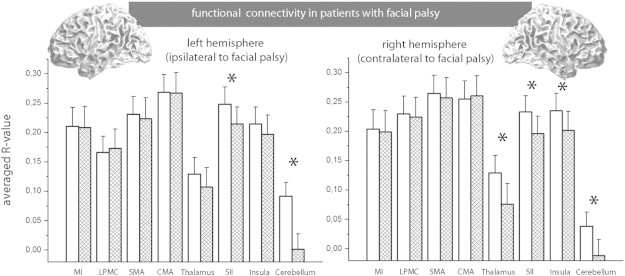
Functional connectivity was measured between one distinct area and all other areas. These values were averaged between subjects. The figure shows the R-values of the Pearson correlation. The white columns represent healthy controls, while the checkered columns represent subjects with facial palsy. A large column indicates a high R-value, corresponding to higher positive connectivity. Significant differences between both groups (P < 0.05, Bonferroni-corrected) are marked by an *.