
Figure 7.
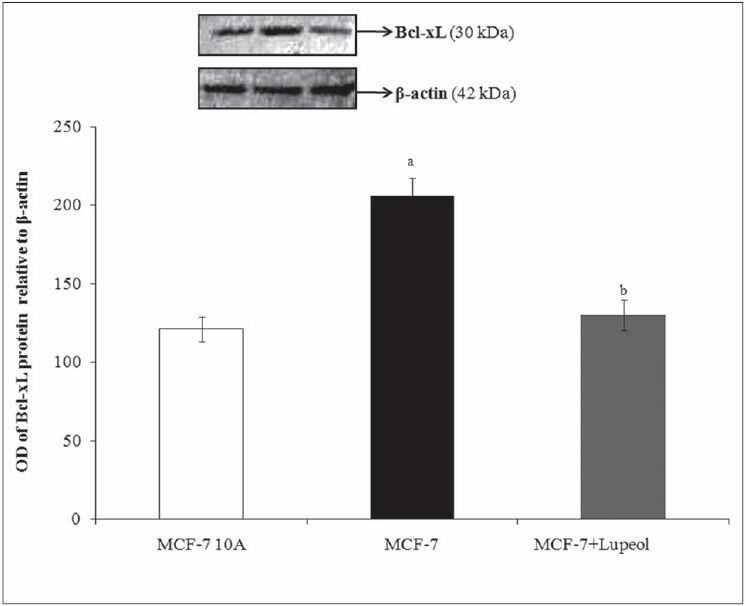
Effect of lupeol on Bcl-xL protein expressions - L1–Control MCF-10A; L2 – Control-MCF-7; L3 – 80 μM lupeol treated MCF-7. Each bar represents the mean ± standard error of the mean of three independent observations with statistical significance between control and the treated groups at P < 0.05 level – (a) compared with MCF-10A normal control, (b) compared with MCF-7 control