
Fig. 1.
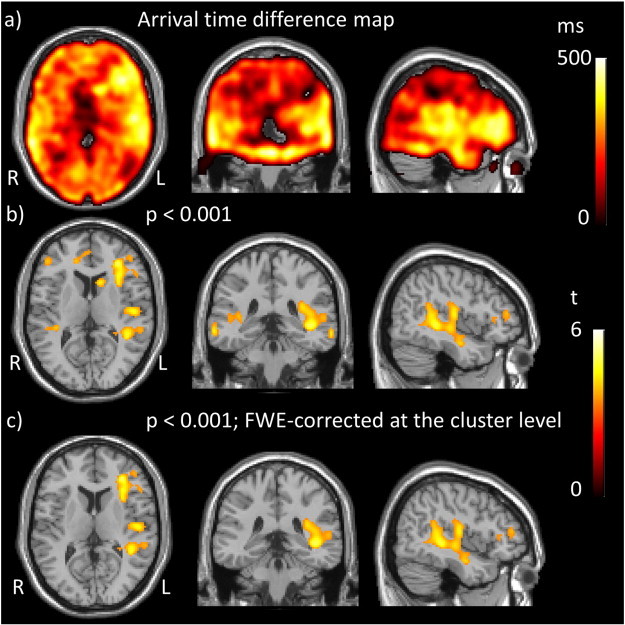
Regions of prolonged arrival time in IPD compared to controls. a) Arrival time difference map created by subtraction of mean AAT in controls from mean AAT in patients. b) t statistic map obtained by comparison of AAT between the IPD group and controls thresholded to p < 0.001 uncorrected, minimum cluster size 100 voxels and c) t statistic map thresholded at p < 0.001 FWE-corrected with minimum cluster size 100 voxels. Thus displaying positive t values, representing increased AAT in the IPD group compared to controls (there were no regions of decreased AAT).