
Fig. 3.
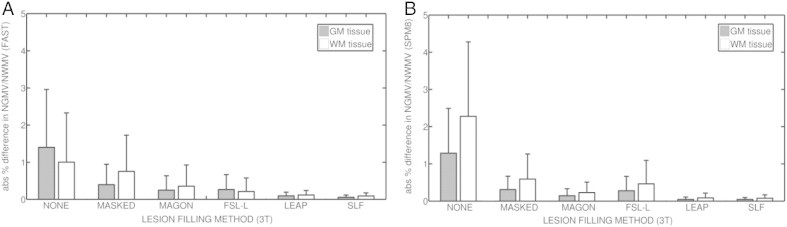
Absolute mean % difference in NGMV and NWMV between original and filled images from the IXI (3 T) dataset. (a) Results for images segmented using FAST. (b) Results for images segmented with SPM8. Gray bars represent the absolute mean % difference in NGMV, while white bars represent the absolute mean % difference in NWMV. Lines above each bar represent the standard deviation for each method and tissue.