
Fig. 4.
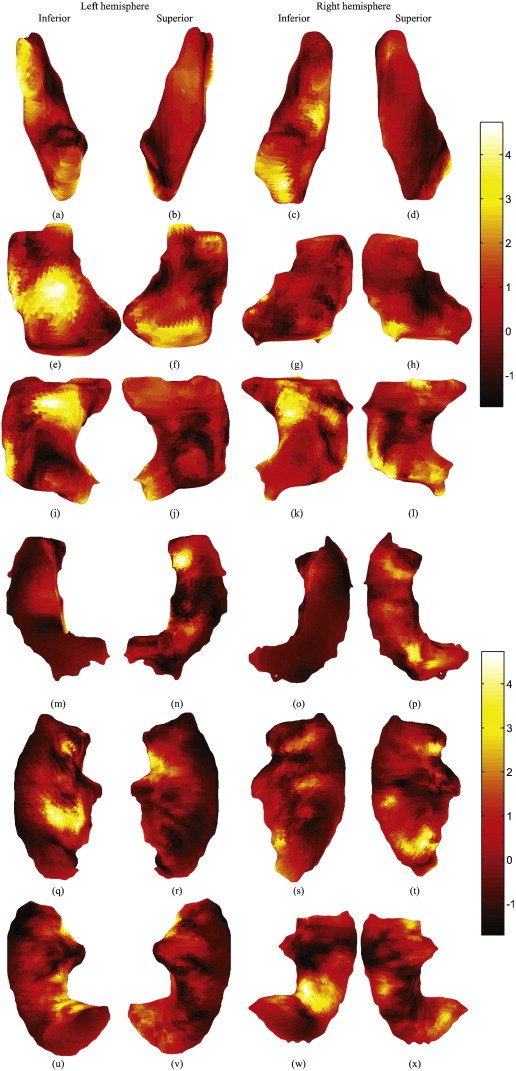
Shape principal component that was significantly different between the two groups. The component is normalized by removing the mean and divided to its standard deviation. Inferior and superior views of the (a, b) left putamen, (c, d) right putamen, (e, f) left hippocampus, (g, h) right hippocampus, (i, j) left parahippocampal gyrus, (k, l) right parahippocampal gyrus, (m, n) left superior temporal gyrus, (o, p) right superior temporal gyrus, (q, r) left middle temporal gyrus, (s, t) right middle temporal gyrus, (u, v) left inferior temporal gyrus, and (w, x) right inferior temporal gyrus. The color smoothly varies from black through red, orange, yellow and white, to show the minimum through maximum difference values. Left side of the pictures shows the left side of the brain, right shows right side, top is the anterior and bottom is the posterior.