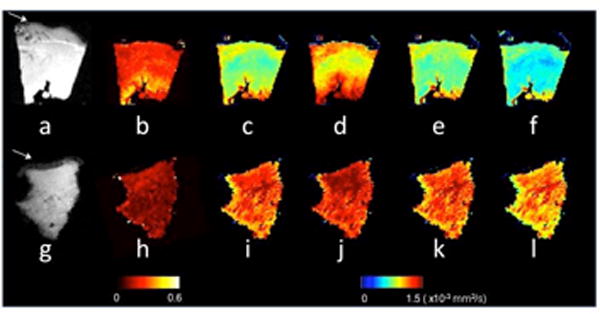
Figure 1.

Representative DTI scalar maps from control and failing heart cores. The top panel shows a MR image without diffusion weighting (B0), FA, MD, D1, D2, and D3 maps for normal (a-f), whereas the lower panel shows the failing core (g-l). A transverse view is shown, with the endocardium located at the top. The pericardial fat visible in the B0 image (white arrows in a and g) was segmented out in the DTI processing step. The DTI parameters are shown in falsecolor according to the colorbars, and all diffusivities had the same color scaling with units of 10-3 mm2/s.
