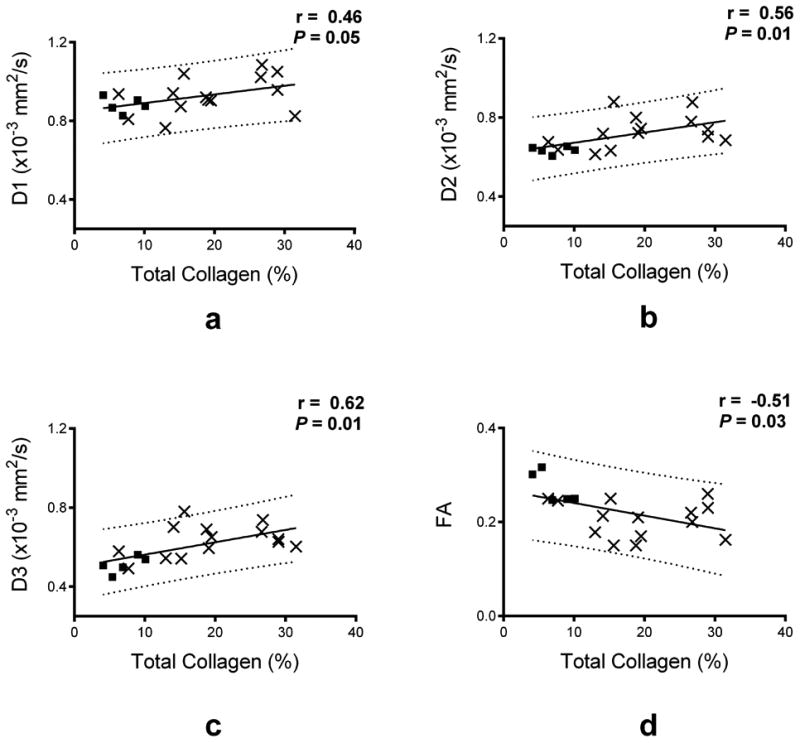
Figure 3.

Quantitative correlation between DTI scalar parameters and collagen content. Scatter plots of FA, D1, D2 and D3 as a function of collagen content are shown with the experimental data (displayed as solid squares for the control group, and as x for the failing group) and the linear regression fit (solid black line) and the 95% prediction interval (dashed lines). The linear regression coefficient (r) and its corresponding P value are reported with each plot.
