Figure 4.
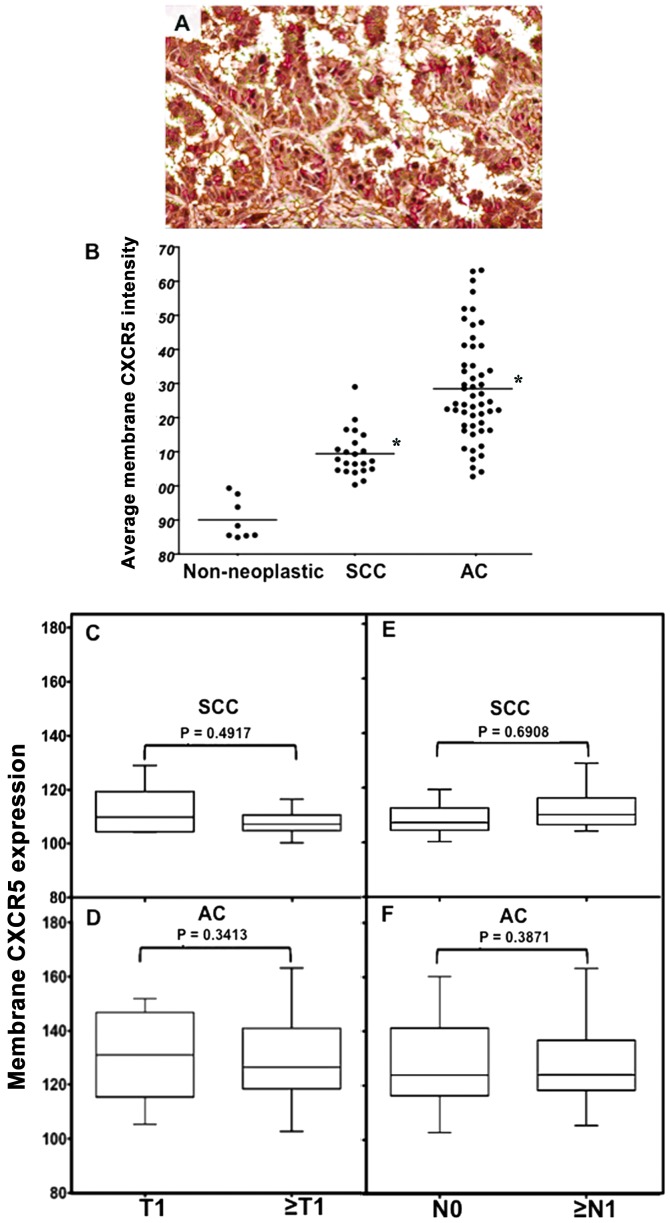
Membrane CXCR5 expression by lung cancer (LuCa) tissues. (A) Representative figure of non-neoplastic (n=8), squamous cell carcinoma (SCC) (n=22) and adenocarcinoma (AC) (n=52) lung tissues stained with isotype control or anti-CXCR5 antibodies. Brown [3,3′-diaminobenzidine (DAB)] color show CXCR5 staining. An Aperio ScanScope CS system with a 40× objective captured digital images of each slide. The membrane intensity of CXCR5 was quantified using a membrane algorithm of image analysis Aperio ImageScope v.6.25 software. (B) The membrane intensity of CXCR5, in non-neoplastic (n=8), SCC (n=22), and AC (n=52) tissues, quantified using a nuclear algorithm of image analysis Aperio ImageScope v.6.25 software. *Significant differences (p<0.001) between groups with LuCa and control. (C–F) Membrane intensities of CXCR5 for different tumor stages and for tumors with nodal involvement in SCC and AC cases, respectively.

