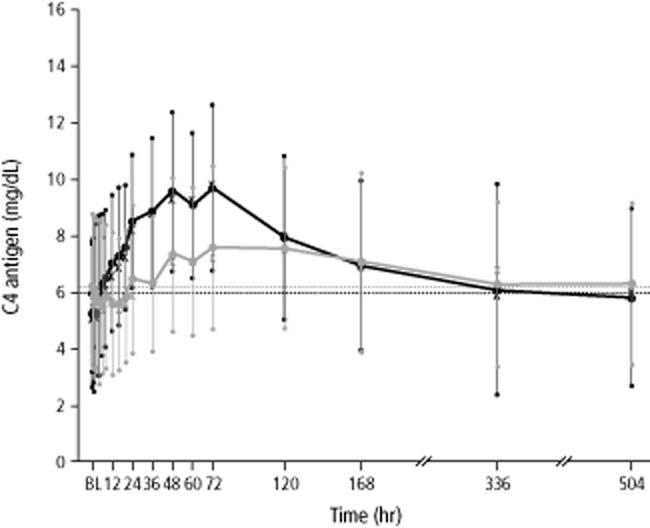
Figure 3.

Mean concentrations of C4 antigen over time (pharmacokinetic per-protocol set, n = 23 subjects). Black and gray whiskers show SDs. Median values are indicated with “X.” Horizontal lines show baseline (BL) values (before first administration of study drug). Data for mean concentrations of C4 antigen at 336 and 504 hours were obtained in only six subjects. ( ) IV; (
 ) SC.
) SC.
