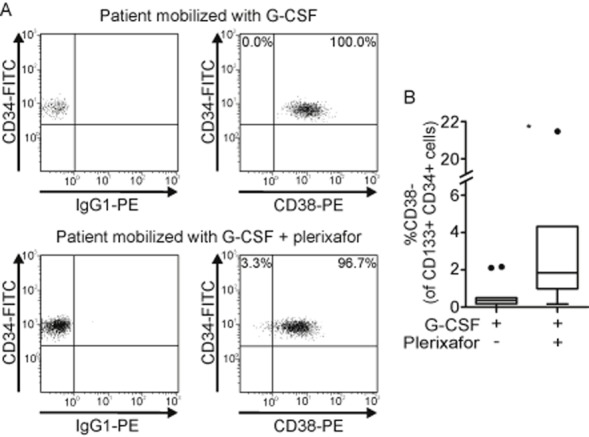
Figure 2.

CD34 and CD38 expression on CD133+ HCs in leukapheresis products. (A) The dot plots show the surface expression of CD34 and CD38 on pregated CD133+ HCs and are representative for 11 leukapheresis products collected after G-CSF (top) and seven leukapheresis products collected after G-CSF plus plerixafor administration (bottom). (B) Percentages of CD38– cells within the CD133+/CD34+ cell population in G-CSF (n = 11) compared to G-CSF plus plerixafor (n = 7). *p < 0.05.
