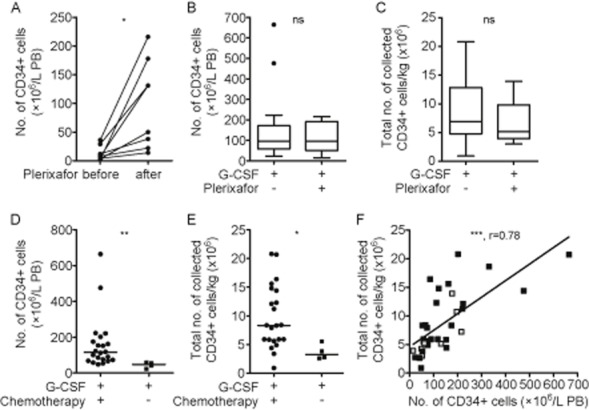
Figure 3.

Plerixafor rescues HSPC mobilization in poor mobilizers. (A) Numbers of preapheresis CD34+ cells (×106/L PB) 1 day before and the next morning after plerixafor injection in poor mobilizers as determined by flow cytometry (n = 8). (B) Comparison of preapheresis CD34+ cell counts (×106/L PB) in good mobilizers receiving G-CSF (n = 28) and poor mobilizers receiving G-CSF plus plerixafor (n = 8). (C) Numbers of CD34+ cells/kg collected after G-CSF– (n = 26) or G-CSF plus plerixafor–induced mobilization (n = 8). Results are illustrated in box plot format, indicating the median. The 25th and 75th percentiles are marked by the edges of the box and the minimum and maximum observations (excluding outliers) are marked by the whiskers. Outliers are defined as cases that are more than 1.5-fold the interquartile range away from the edges of the box and are indicated as dots. (D) Preapheresis CD34+ cell numbers (×106/L PB) of good mobilizers who did (n = 22) or did not (n = 4) receive chemotherapy immediately before G-CSF. (E) Total CD34+ cell numbers/kg collected from good mobilizers, who received chemotherapy before G-CSF (n = 22) or not (n = 4). (F) Correlation of preapheresis CD34+ cell numbers (×106/L PB) with total CD34+ cells/kg collected via leukapheresis. (■) Patients treated with G-CSF (n = 27); ( ) patients treated with G-CSF plus plerixafor (n = 8). *p < 0.05; **p < 0.01; ***p < 0.001; ns = not significant.
