
Figure 4.
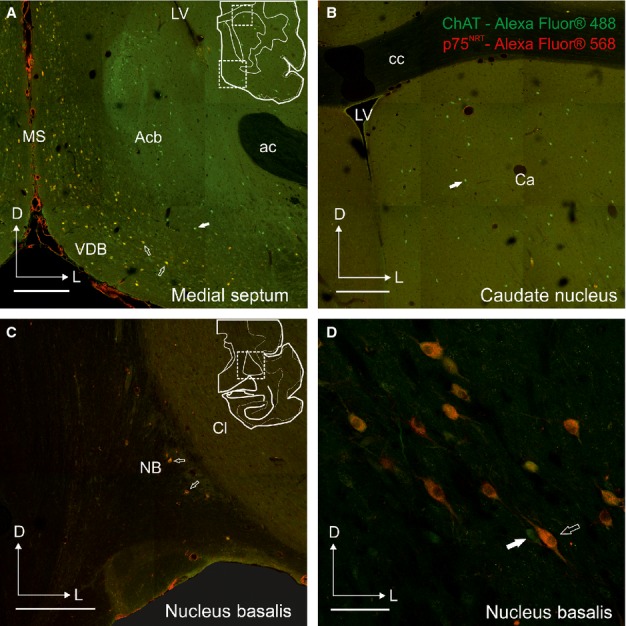
Distribution of cells co-localizing ChAT and p75NTR in the ferret forebrain. Examples of coronal sections taken from the right hemisphere at the level of the MS and VDB (A), Ca (B), and more posterior at the level of the NB (C and D). The cartoons in A and C indicate the location of the photographs shown in A and B, and C and D, respectively. The majority of cells in the BF that are ChAT-positive co-localize p75NTR, whereas this is not the case for ChAT-immunopositive cells in the striatum. Calibration bars = 0.5 mm in A–C and 100 μm in D. ac, anterior commissure; Acb, accumbens nucleus; Ca, caudate nucleus; cc, corpus callosum; ChAT, choline acetyltransferase; Cl, claustrum; D, dorsal; L, lateral; LV, lateral ventricle; MS, medial septum; NB, nucleus basalis; p75NTR, low-affinity neurotrophin receptor; VDB, diagonal band of Broca vertical limb.