
Figure 7.
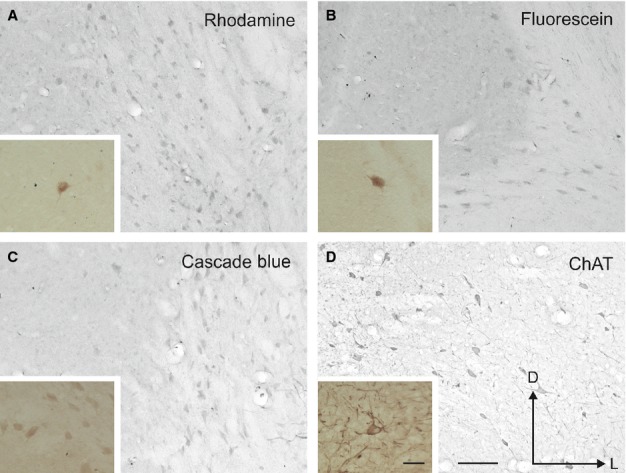
Examples of labelled cells in the NB after cortical tracer deposits of rhodamine in the MEG (A), fluorescein in the PEG (B) and cascade blue in the AEG (C). ChAT immunoreactivity in the NB is shown for comparison (D). Pictures were taken in the NB ipsilateral to the cortical tracer deposits (shown in Fig.6). The insets in the left bottom corner of each panel show labelled neurons at higher magnification. The orientation and calibration bars = 100 μm in D and 50 μm in the inset; these are the same in all panels and insets. ChAT, choline acetyltransferase; D, dorsal; L, lateral.