
Figure 14.
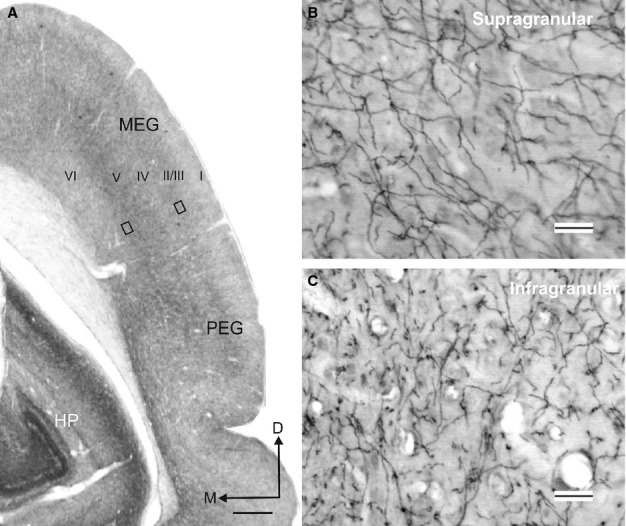
Acetylcholinesterase (AChE) staining in the auditory cortex. (A) Coronal section at the level of the auditory cortex in the EG illustrating the variation in AChE fibre density across the cortical layers. (B and C) Details from the two rectangles in A taken at higher magnification to show AChE-positive fibres in the supragranular and infragranular layers of the cortex, respectively. Calibration bars = 1 mm in A and 25 μm in B and C. I, II/III, IV, V, VI, cortical layers 1–6; D, dorsal; EG, ectosylvian gyrus; HP, hippocampus; M, medial; MEG, middle ectosylvian gyrus; PEG, posterior ectosylvian gyrus.