
Table 2.
Proximate composition of aquatic edible insects.
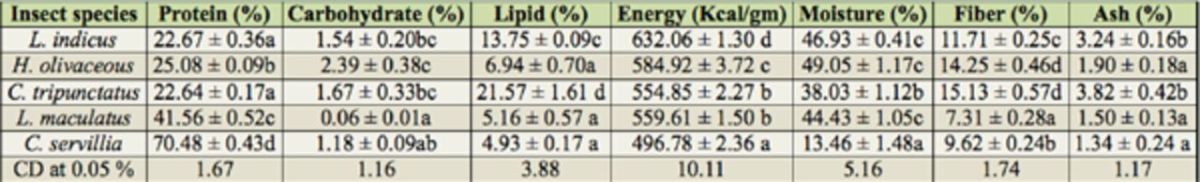
All values are mean ±SE. Means followed by the same alphabet in the same column are not significantly different (p < 0.05).
Official websites use .gov
A
.gov website belongs to an official
government organization in the United States.
Secure .gov websites use HTTPS
A lock (
) or https:// means you've safely
connected to the .gov website. Share sensitive
information only on official, secure websites.
Proximate composition of aquatic edible insects.
All values are mean ±SE. Means followed by the same alphabet in the same column are not significantly different (p < 0.05).