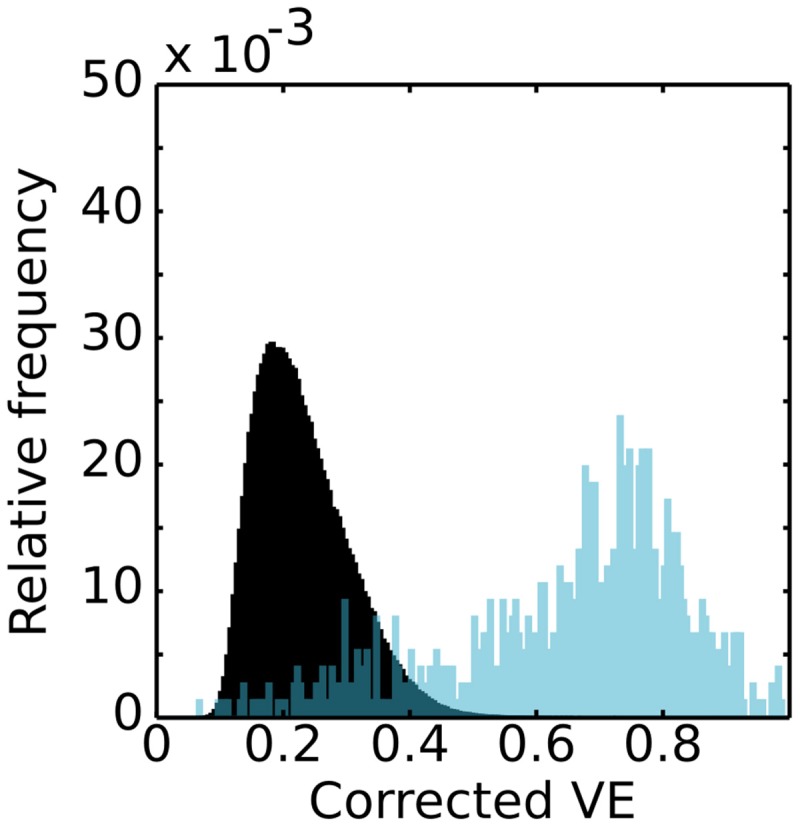
Figure 1.

Distributions of variance explained. Histogram of relative frequency of recording sites in V1-referred connective field models in V2 as a function of their variance explained. The black distribution represents the hypothesis of non-discriminability (noisy and spatially uncorrelated signals obtained with the IAAFT method) and was generated by fitting connective field models to surrogate BOLD signals. The blue distribution illustrates a typical outcome for an actual resting state scan.
