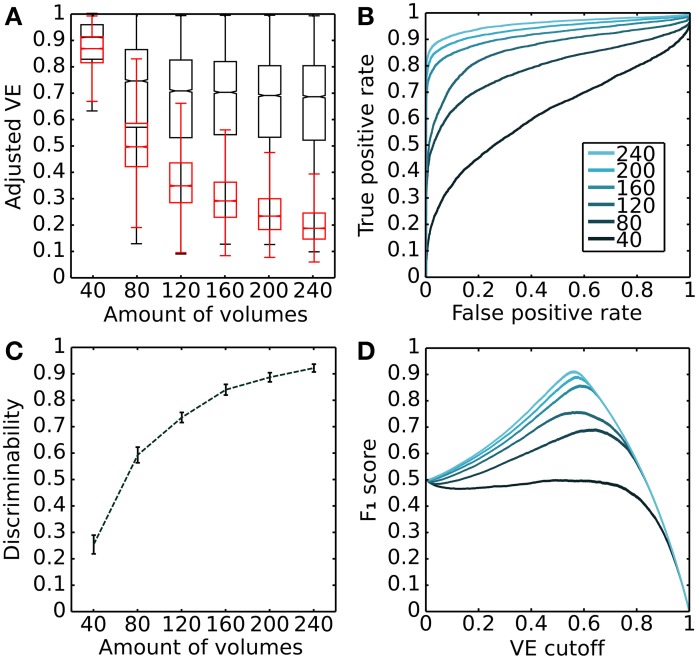
Figure 2.
Overall modeling performance characteristics for a single subject. (A) Dependence of variance explained on the amount of volumes. The whisker box-plots illustrates the distributions of variance explained adjusted by degrees of freedom. Red distributions were obtained from RS data and black distributions from surrogate RS data. The central mark is the median, the edges of the box are the 25th and 75th percentiles, and the whiskers indicate the most extreme data points with an interquartile range of 1.5 (Tukey box-plot). (B) Receiver operating characteristic (ROC) curves corresponding to each amount of volumes. (C) Discriminability increases as a function of the amount of volumes (we choose discriminability index in the form of informedness: 2*AUC-1, equivalent to Gini coefficient). (D) Discrimination accuracy (F1 score) as a function of the adjusted EV cut-off threshold for each amount of volumes (colors as in B). Data are for V1 ➤ V2 CF models from subject 3.

