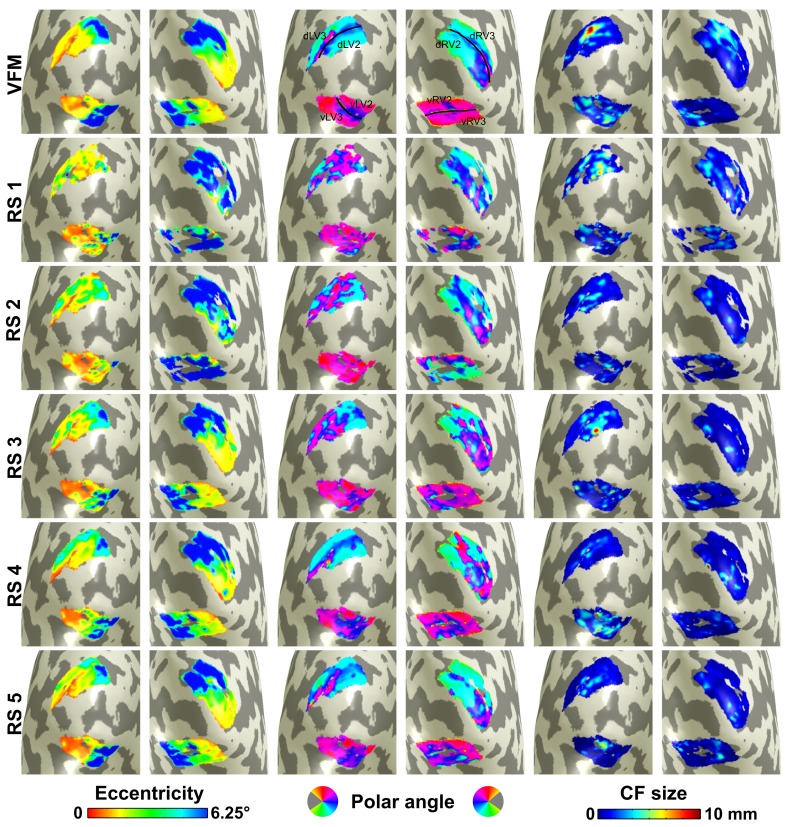
Figure 3.
Visualization of connective field maps for a single subject. From left to right: eccentricity, polar angle, and size. Top panel corresponds to visual field mapping (VFM)-based estimates. Lower panels show parameter estimates for each resting state (RS) scan. For V1 ➤ V2 CF models, the position displacement in CF cortical location (in mm) between VFM- and RS-based estimates for RS1 to RS5 is: median (MAD) = 10.0 (5.4); 8.5 (5); 5.8 (3.7); 3.8 (3.4); and 4.1 (3.0), respectively [total = 5.4 (3.9)]. Corresponding position displacement values between RS4 and RS5 (the RS scans with lowest displacement: 4.1 (3.1); between RS1 and RS2 (the RS scans with highest displacement): 8.5 (5.8); between RS1 and RS4: 10.5 (6.6); when grouping results for all RS scan pairs: 8.6 (5.9). For V1 ➤ V3 CF models, the corresponding values are: 13.6 (6.3); 14.4 (6.8); 7.9 (5.4); 6.7 (5.5); and 7.1 (4.2) [total = 8.7 (5.5)]. Eccentricity and polar angle are inferred from V1 pRF mapping (see Materials and Methods for details). Data are for V1 ➤ V2 and V1 ➤ V3 models estimated for subject 3 (data for other subjects included in Supplementary Materials). A threshold of 0.35 VE was applied. Median cortical displacements reflect the agreement between RS and VFM maps and between different RS maps.

