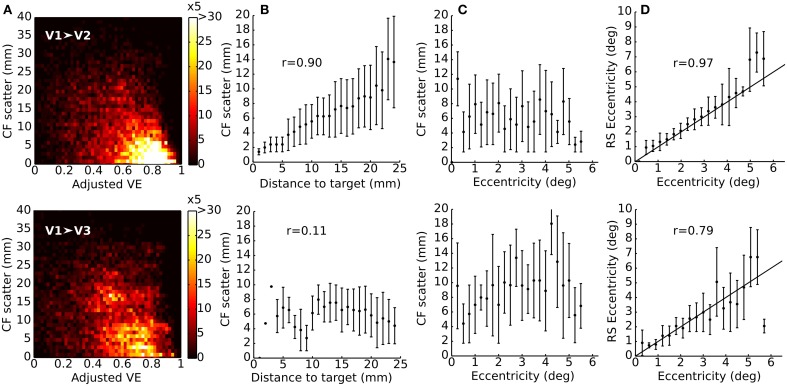
Figure 4.
Position scatter for V1-referred connective fields for a single subject. (A) Joint histogram of cortical displacement in V1-referred CF centers as a function of adjusted VE. The goodness of fit tends to decrease with larger displacements (colorbar depicts frequency of voxels after grouping data from all RS scans; the number of voxels that entered the analysis is: 1622 for V1 ➤ V2 and 1467 for V1 ➤ V3). (B) Position scatter as a function of the distance from the target voxel. A cortical distance effect can be seen in V1 ➤ V2 (R = 0.90, p < 0.0001) but not in V1 ➤ V3 (R = 0.11, p < 0.0001). (C) No systematic deviations from the median distance are observed for eccentricity (data was binned in eccentricity bins of 0.25°). Points represent the median of each bin and error-bars the median absolute deviation for the corresponding bin. (D) There is good agreement between RS-based eccentricity and VFM reference eccentricity (V1 ➤ V2: R = 0.97, p < 0.0001; V1 ➤ V3: R = 0.70, p < 0.0001) (data was binned in eccentricity bins of 0.25°. Points represent the median of each bin and error-bars the median absolute deviation for the corresponding bin). Data are from subject 3. A cutoff threshold of 0.5 VE (F1 ~0.85) was applied in (B–D).

