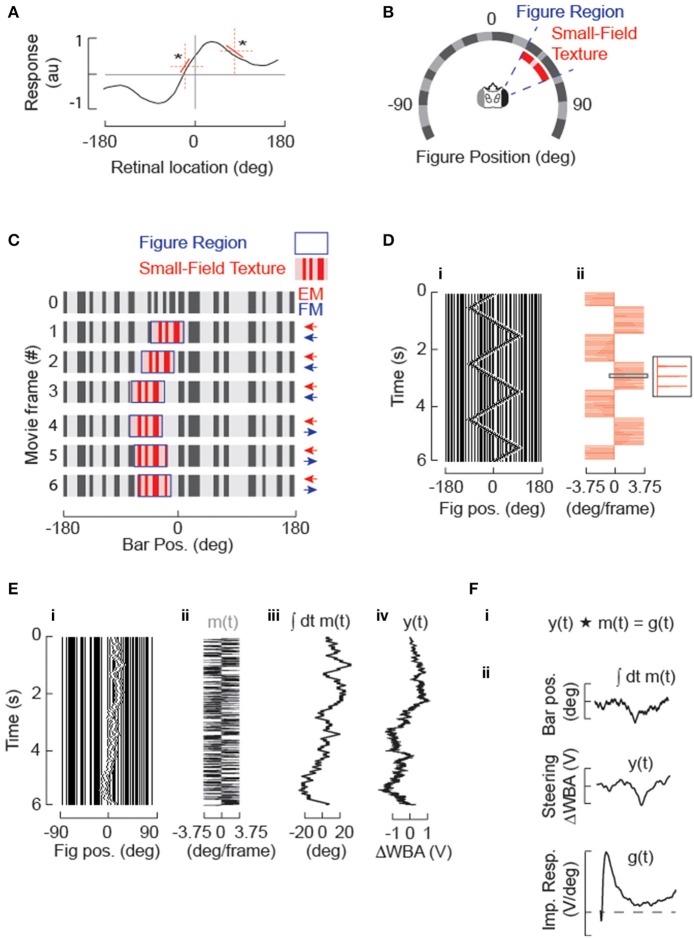
Figure 1.
Systems identification approach for studying figure tracking behavior. (A) The amplitude of steering responses to arbitrary figure motion (or stationary flicker) may be non-linear over the visual field, (* highlight two regions with different local rate of change in the dynamics of the steering response) but can be approximated over small spatial domains by a linear function (red). The STAF methodology approximates this steering response by estimating linear filters from m-sequences that are localized in space. (B) A circular display subtends 330° of the fly's visual field. The stimulus sequences are panoramic and 96 pixels in extent, but 8 physical pixels subtending 30° are omitted from the back of the display for access. A vertical grating of randomly segregated ON and OFF elements makes a stationary background containing broad band spatial wavelengths. A figure is defined by a 30° window (delineated in blue), within which the surface texture (denoted in red) varies from and replaces the background. The spatial statistics of the internal texture matches those of the background. The figure window itself can be displaced independently from the texture within it. (C) Example of figure motion. The figure is composed of the same pseudo-random pattern as the ground, therefore the figure is defined only by its relative movement. Displacement of the window provides figure motion (FM, highlighted in blue) that is undetectable by a standard motion detection model, which can be modulated independently from the displacement of the surface texture that generates small-field elementary motion that would be readily detected by an EMD-based system (small-field elementary motion [sf-EM] highlighted in red). In this simple case, a first-order “Fourier bar,” FM and sf-EM move coherently in the same direction for frames 1–3. In frames 4–6, FM is toward the right and there is no sf-EM within the figure window (i.e., the pattern within this window remains stationary). (D) A Fourier bar is displaced in one pixel steps 90° back-and-forth across the visual azimuth. (i) is a space-time plot of the stimulus (in which azimuth constitutes the only spatial dimension), and (ii) illustrates how that each 3.75° step (minimum pixel-spacing in LED arena) in the position of the figure corresponds to an impulse in velocity. (E) Motion of the solid Fourier bar (i.e., FM = sf-EM) is modulated by velocity impulses controlled by a m-sequence (see Methods) producing a pseudo-random motion trajectory centered in this case near visual midline. (i) Space-time plot of movie; (ii) m(t), pseudorandom sequence of impulse responses in velocity; (iii) position [time-integral of m(t)] of the figure; (iv) y(t), animal steering response to stimulus in (i). (F) Cross-correlation of the m-sequence (m) in degrees with the animal's steering response (y) proportional to the difference in amplitude across the two wings (ΔWBA) provides an estimate of the velocity impulse response (g).

