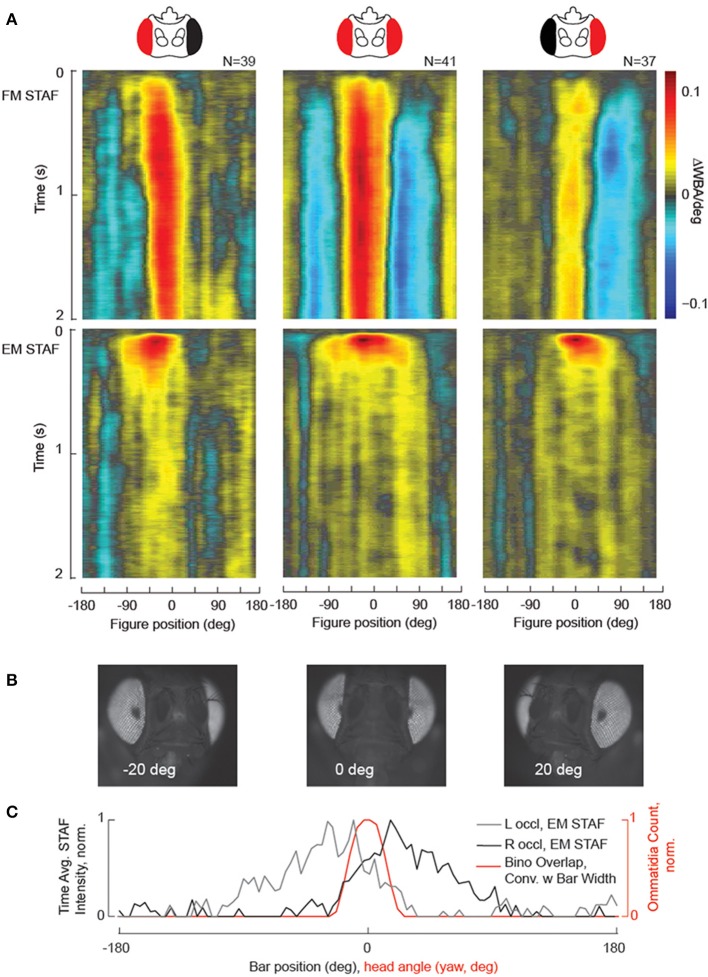
Figure 6.
Localized visual deficits are revealed by the STAFs, and indicate the region of binocular vision. (A) Black paint was applied to one eye (see Methods for details), which at least partially occluded vision in that eye. FM and sf-EM STAFs are plotted for right occluded flies (left column), intact (center column) and left occluded wild-type flies (right column). (B) Images taken from an epi-fluorescent microscope showing the pseudopupil appearing for azimuthal visual angles as indicated. (C) The spatial extent of binocular overlap was determined by measuring the size of the pseudopupil appearing on both compound eyes (red) for a single animal imaged across the visual horizon at zero degrees elevation (the ommatidial lattice is similar at each elevation, data not shown). The time-averaged spatial profile of the sf-EM STAFs for the right-occluded flies (gray) and left-occluded flies (black) is superposed with the estimate of binocular overlap. Note that the contralateral extent of the sf-EM STAF coincides with the region of binocular overlap.

