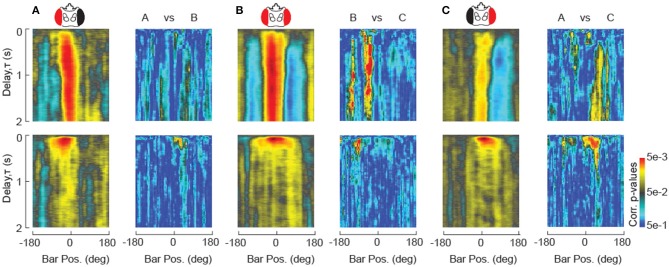
Figure 7.
Statistical comparison of STAFs. (A–C) STAFs computed for unilaterally occluded flies are re-plotted form Figure 4. For each pair of STAFs as indicated, paired t-test measurements at each pixel are plotted in pseudocolor after Benjamini-Hochberg false discovery rate correction (Benjamini and Hochberg, 1995).

