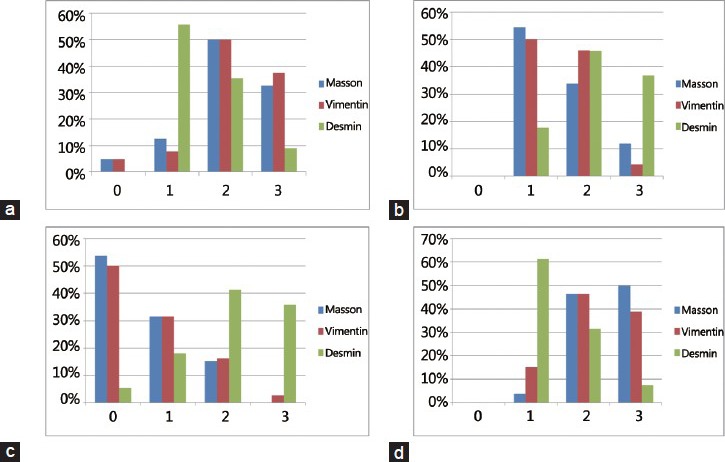
Figure 2.

Distribution of reactive stroma in tumors with different Gleason score. (a) Stroma grade in the tumors with Gleason score of 6–7, (b) Stroma grade in peritumoral tissue with Gleason score of 6–7, (c) Stroma grade in the tumors with Gleason score of 8-9, (d) Stroma grade in peritumoral tissue with Gleason score of 8–9.
