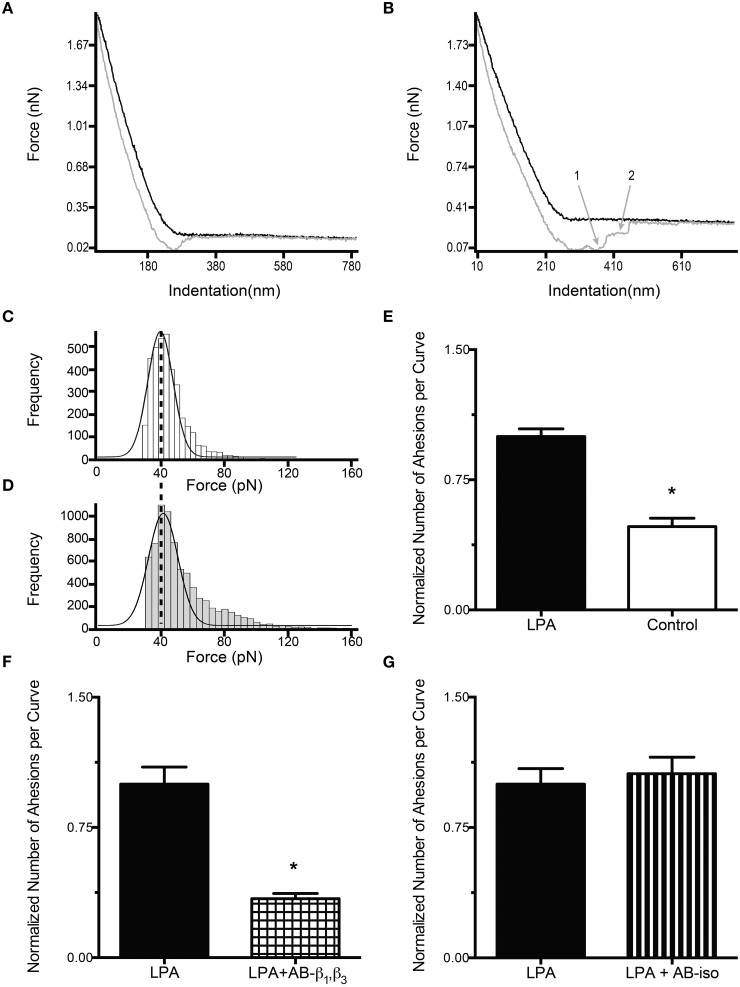
Figure 1.
LPA increases the adhesion between FN and integrins containing β1 and β3 subunits. (A–B) Typical force curves obtained during AFM adhesion experiments. The black line represents the cantilever approach curve, while the gray one represents the retraction curve. The numbers on gray curves represent adhesion events detected as sharp vertical jumps in the retraction curve. (A) Force curve with no adhesion events. (B) Force curve with 2 adhesion events (1, 2). Force adhesion events distribution for control (C) and LPA treated cells (D). The number of single adhesion events (first peak) in the LPA treated cells (D) increases significantly above the control level (C). The adhesion force is not changed by LPA treatment. (E) VSMC adhesion to FN is reduced significantly, by 52%, in untreated (control) cells (n = 40) compared to LPA treated cells (n = 40). (F) The incubation of VSMC with LPA (2 μM) in the presence of β1 and β3 (50 μg/ml) antibodies (n = 40) resulted in a 66% decrease in the number of adhesion events per curve compared to VSMC treated with LPA alone (n = 40). (G) Compared with the VSMC treated with LPA alone (n = 40), LPA treatment (2 μM) in the presence of isogroup control antibody (50 μg/ml), does not significantly change the number of adhesion events per curve (n = 38). Data are means ± s.e.m. *P < 0.05 vs. LPA (E,F).

