
Figure 2.
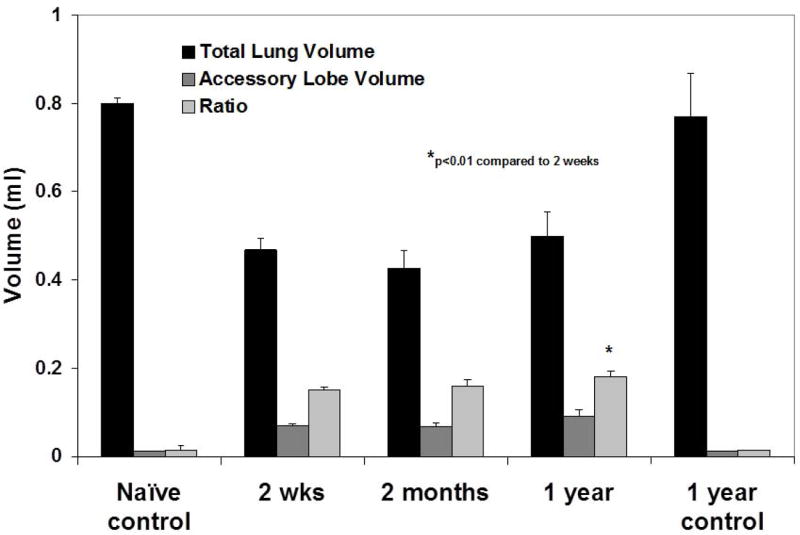
A: Quantitative assessment of the total lung volumes from the CT scans demonstrates disproportionate growth of the right accessory lobe over one year post-pneumonectomy. Values represent means ± standard deviations from 3 (naïve 2 week control, naïve 1 year control), 6 (2 month PNMO), or 7 (2 week PNMO, 1 year PNMO) representative mice assessed at each time point.
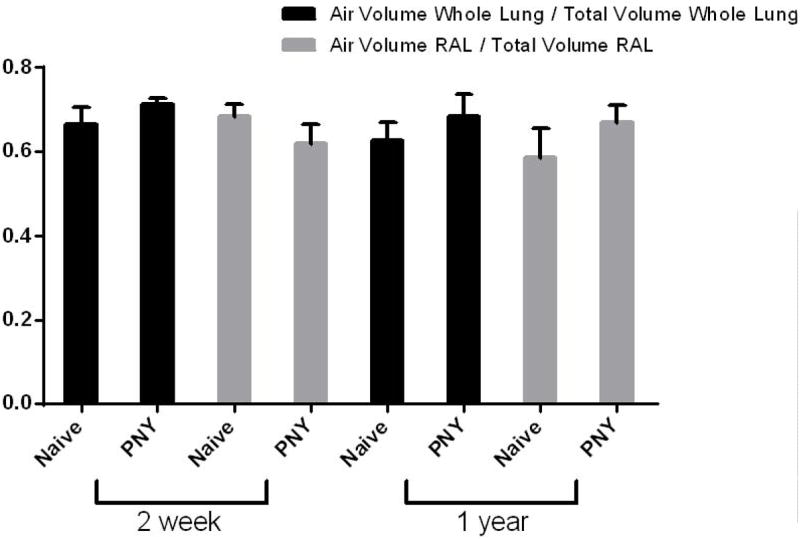
B: Assessment of air and total lung volumes demonstrates similar ratios of air/total volumes at both 2 weeks and 1 year post-pneumonectomy compared to each other and to naïve age-matched controls. Values represent means ± standard deviations from 6 (1 year naive), 7 (2 weeks PNY, 1 year PNY), or 8 (2 week naïve) mice assessed at each time point. RAL = Right accessory lobe.