
Fig. 3. Heat maps of mass spectrometric assessments of residual proteins.
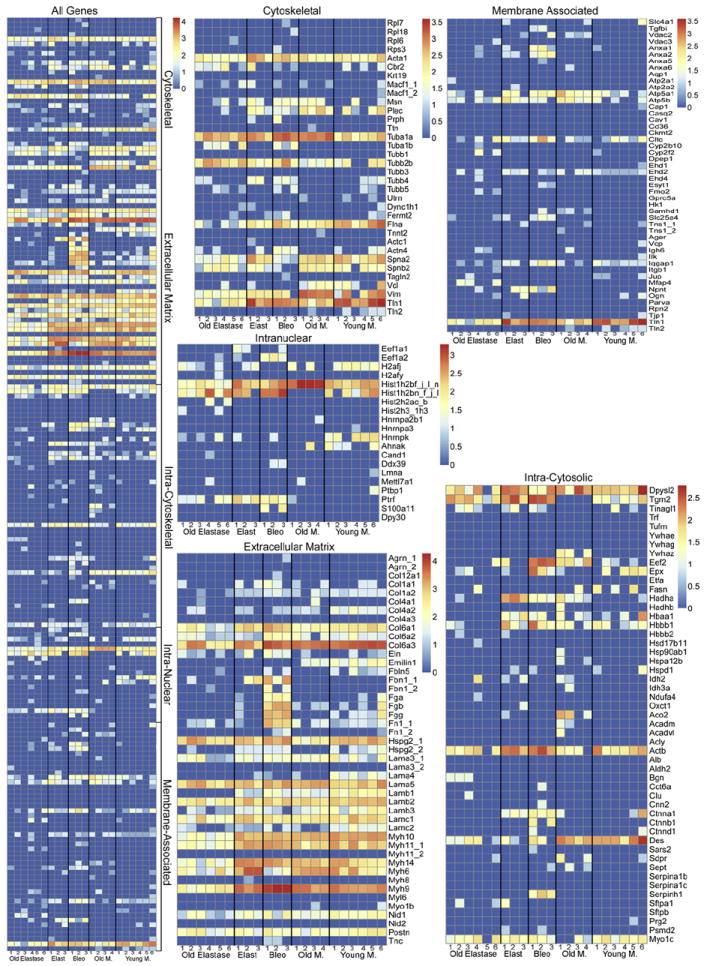
The combined heat map and specific heat maps for each of the designated protein categories are shown. The color scheme represents log order transform values which depict the relative abundance of each protein compared to presence in freshly de-cellularized lungs.