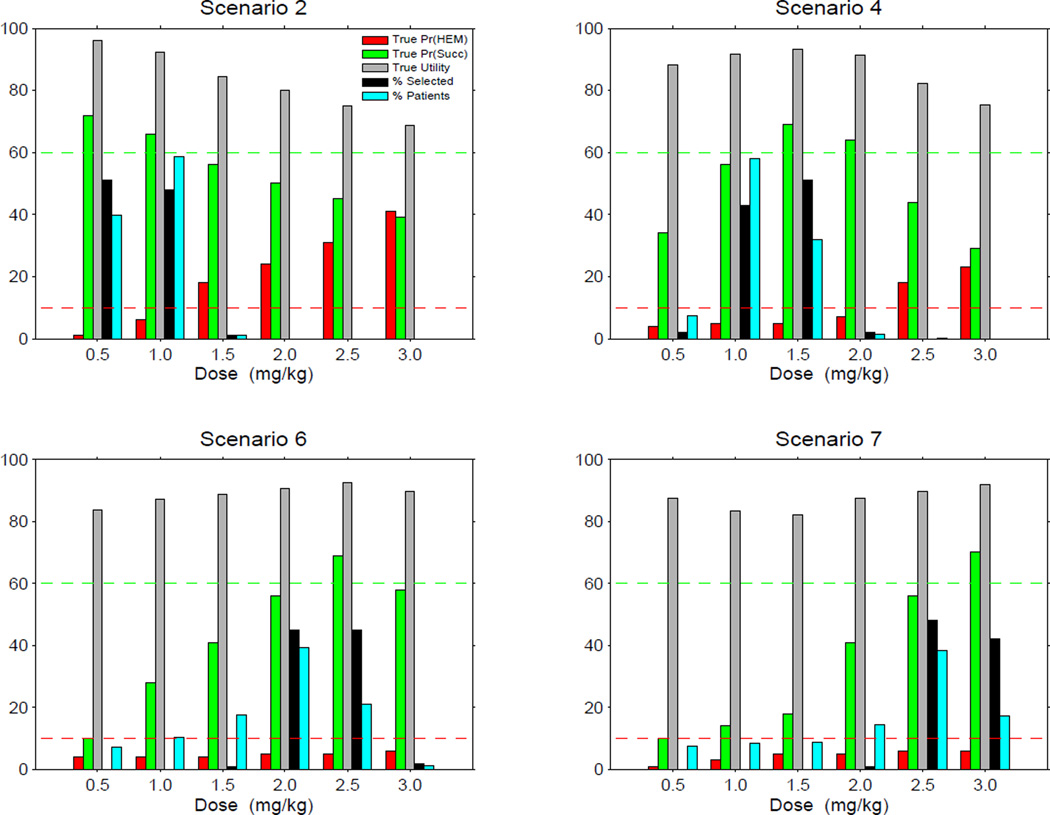
Figure 1.
Simulation results for the design Uopt + Acc using the greedy algorithm with safety and efficacy acceptability rules, under four selected scenarios. For convenience, probabilities as percentages, utilities, and selection percentages are given together in the same plot. Horizontal dashed lines show the upper limit 10% for πH(dose) and lower limit 60% for πS(dose).

