
Figure 5.
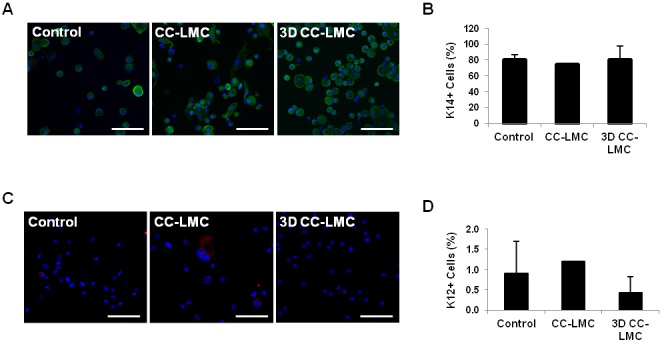
Quantification of K14+ and K12+ cells. (A) Representative images of K14+ LECs in control, CC-LMC, and 3D CC-LMC culture. (B) Percentage of K14+ cells in each culture system. (C) Representative images of K12+ LECs in the control, CC-LMC, and 3D CC-LMC culture. (D) Percentage of K12+ cells in each culture system. Scale bars: 100 μm.