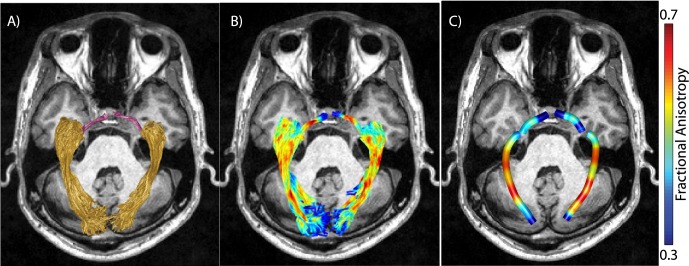
Figure 4.

Identification of tract profiles. (A) Optic tract (purple) and optic radiation (yellow) identified in a representative subject. (B) Values of FA in optic tract and optic radiation voxels (red, high FA; blue, low FA). (C) Values of FA averaged along optic tract and optic radiation. Averaged FA values along the pathway based on weighted-linear sum of voxel-wise FA values based on the distance from the core of the pathway.
