
Figure 5.
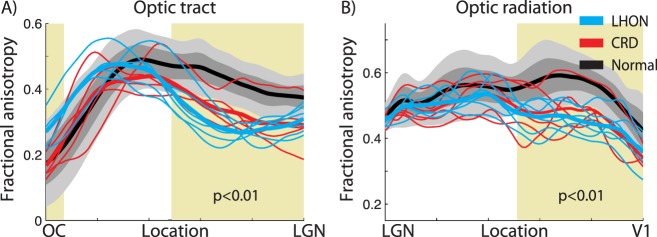
Fractional anisotropy along the core of the optic tract and the optic radiation. The two panels show the FA measures in (A) the optic tract and (B) the optic radiation. Individual LHON (blue) and CRD (red) patients are compared with the distribution of measurements from the controls (gray shaded). Thick curves show the mean of each group (LHON: blue; CRD: red; control: black). The lighter gray shades show range of ±2 SD from the control mean, and the darker gray band shows ±1 SD from the control mean. x-axis describes normalized position along the tract. Shaded yellow region indicates the portion of the tract showing a significant main effect of subject groups in FA value (one-way ANOVA, P < 0.01).