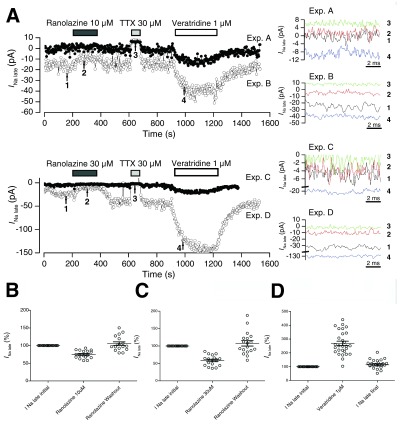
Figure 2. Effects of ranolazine, TTX and veratridine on the late Na + current in Nav1.5-expressing cells.
A. Time plots of I Na late in four typical experiments. Intervals of application of ranolazine 10 or 30 μM, TTX 30 μM, and veratridine 1 μM are indicated. Right panels: I Na late traces from 260 to 270 ms at the time points marked with arrows and numbered in the left panels. B and C. Effects of ranolazine 10 and 30 μM, respectively, on relative levels of TTX-sensitive late Na + current. D. Effect of veratridine 1 μM. Mean values are indicated for each condition, and error bars represent SEM.

