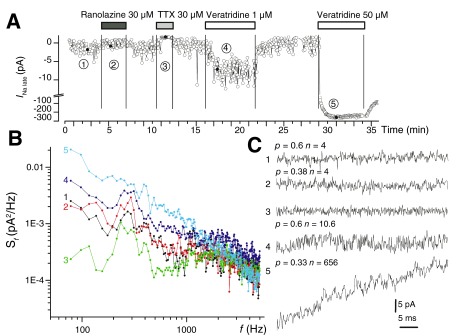
Figure 3. The late Na + current presents fluctuations due to the opening and closure of individual channels.

A. Time course of a typical experiment in Nav1.5-expressing cells showing the effects of ranolazine 30 μM, TTX 30 μM, and veratridine 1 μM on I Na late. B. Averaged Fourier transforms of multiple traces recorded in different conditions in the experiment shown in A: 1. initial control; 2. ranolazine 30 μM; 3. TTX 30 μM; 4. veratridine 1 μM; 5. veratridine 50 μM. C. Fluctuation analysis of individual traces recorded during the five distinct periods shown in A allowed the distinction of individual channel gating events and the computation of the average open probability p and the average number of channels n for each condition.
