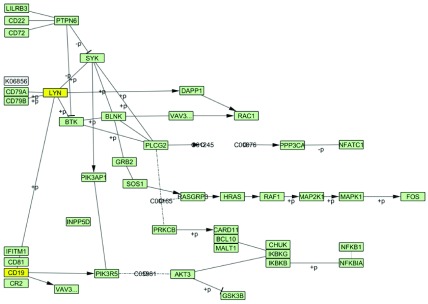
Figure 3. KEGG B cell signaling pathway tuned in CD19 B cells and CD4 T cells.

Tuning was performed with 25 percentile threshold of gene expression values for each tissue. Highlighted in yellow are the nodes (“LYN” and “CD19”) not present in the pathway tuned in CD4 T cells.
