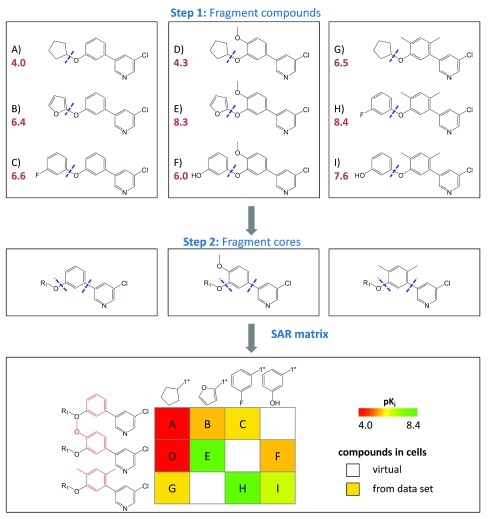
Figure 1. SAR matrix generation.
Three model series with three compounds each ( A– C, D– F, and G– I) are shown with pK i values (red). In the first step, all compounds are fragmented at a single bond (purple dotted line) producing compound MMPs that yield a common core (key) and a compound specific substituents (values). In the second step, the cores resulting from the first step are further fragmented to obtain core MMPs. The SARM is then generated by combining series with structurally analogous cores that represent individual rows. In addition, columns represent substituents. In each cell, the combination of a core and a substituent defines a unique compound. Compounds present in the data set are indicated by filled cells that are color-coded according to potency using a continuous spectrum from red (low potency) over yellow to green (high). In addition, empty cells indicate virtual compounds. Substructures distinguishing the core fragments are highlighted in red.

