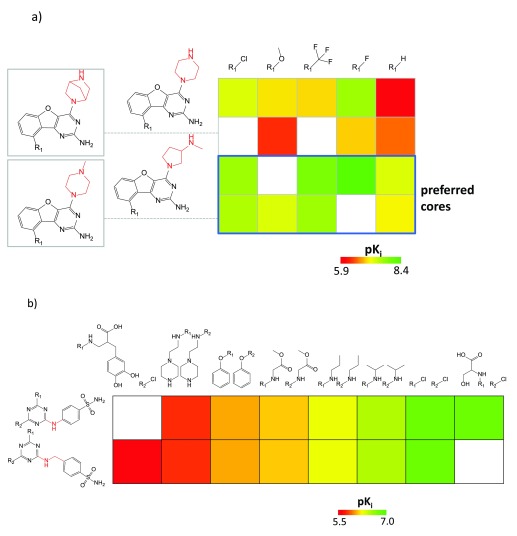
Figure 2. SAR patterns in matrices.
In ( a), a SARM capturing 16 ligands of the histamine H4 receptor is shown. Cells containing analogs with preferred cores yielding potent compounds are framed in blue. Substructures distinguishing the core fragments are highlighted in red. The pK i value range for the 16 ligands is displayed. In ( b), a subset of a double-cut SARM is shown that contains series of carbonic anhydrase I inhibitors and an exemplary SAR transfer event.

