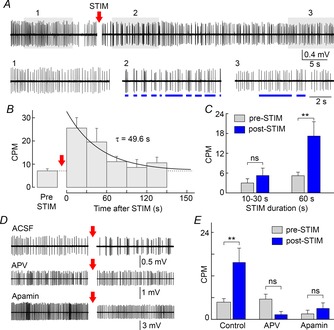
Figure 1. OVLT stimulation induces spike clustering in MNCs.

A, single unit spiking activity recorded from a SON MNC in a hypothalamic explant shows the effect of OVLT stimulation at 10 Hz (STIM) for 60 s (segment removed). Lower traces are segments expanded from the shaded parts of the main trace. STIM caused a reversible increase in spike clusters (blue lines). B, graph shows mean (± SEM) rate of clustering (clusters per minute, CPM) before (pre-STIM; dashed line) and during 5 consecutive 30 s segments after STIM (post-STIM). Continuous line is a mono-exponential fit. C, bar graphs show mean (± SEM) CPM pre-STIM and during the first 20 s post-STIM observed when STIM was applied for 10–30 s or 60 s. D, spiking activity recorded from MNCs before and after STIM in control conditions (ACSF), or in the presence of APV or apamin. E, bar graphs show mean CPM observed pre- and post-STIM in different conditions. **P < 0.01; ns, not significant.
