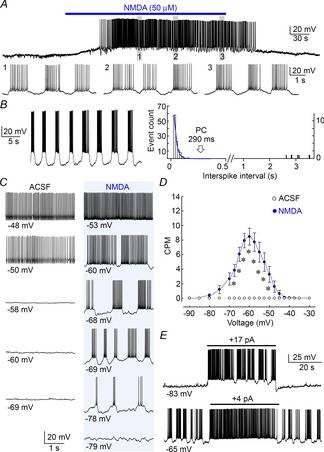
Figure 2. Voltage dependence of NMDAR-induced clustering.

A, upper trace shows a whole-cell voltage recording from a MNC in a hypothalamic slice (excerpts shown below). Bath application of NMDA (bar) caused a reversible depolarization and sustained clustering activity. B, left trace shows an example of NMDA-induced clustering in another MNC. The histogram at right plots the distribution of interspike intervals for the corresponding cell. The blue curve is a single exponential fit of the falling phase of the distribution. The arrow points to the pause criterion (PC), beyond which intervals of greater duration are defined as pauses (see Methods). C, recording segments from a single MNC illustrate the relation between voltage (average of all points, indicated below) and firing pattern in absence (ACSF) or presence of NMDA. Each trace was recorded with different levels of holding current (not shown). D, graph shows mean (±SEM) clustering rate at different voltages in ACSF and NMDA (*P < 0.05). E, traces from MNCs exposed to NMDA show the effects of depolarizing current pulses (bars) applied from different baseline voltages.
