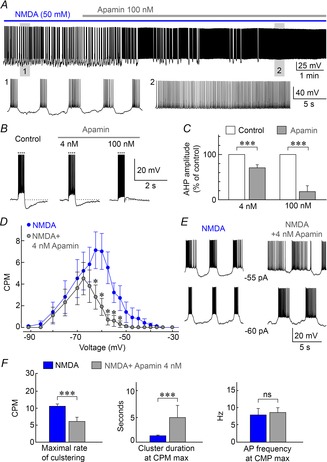
Figure 3. Inhibiting SK channels modulates spike clustering.

A, voltage recording shows the effect of 100 nm apamin (grey bar) on NMDA-induced clustering (blue bar). Lower panels show excerpts of the full trace (as indicated by numbers). B, traces show the effects of apamin on after-hyperpolarizations (AHPs) induced by spike trains triggered by depolarizing current pulses (dotted lines). C, bar graphs show the effects of 4 nm and 100 nm apamin on mean (±SEM) AHP amplitude expressed as percentage of control. D, graph shows the effect of 4 nm apamin on mean (±SEM) clustering rate observed at different voltages. E, traces show the effects of apamin on NMDA-induced clustering activity at fixed levels of current injection (shown). F, bar graphs show the effects of 4 nm apamin on mean (±SEM) maximal clustering rate (CPM max), as well as cluster duration and intracluster spiking frequency at CPM max. *P < 0.05; ***P < 0.005; ns, not significant.
