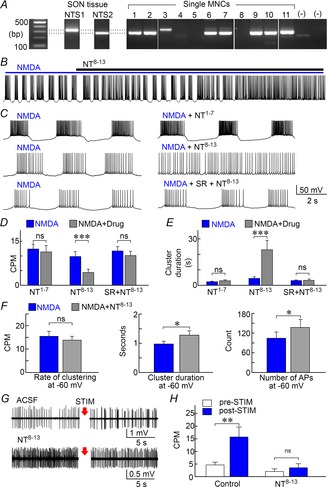
Figure 4. NT receptors modulate NMDAR-dependent clustering in MNCs.

A, PCR detection of mRNAs coding for NTS1 and NTS2 in SON tissue, and in 11 single MNCs ((–) lanes are controls). B, whole-cell recording from an MNC exposed to NMDA shows that addition of NT8–13 inhibits clustering. C, excerpts taken from 3 cells show NMDA-induced activity recorded before (left) and after (right) addition of NT1–7, NT8–13 or NT8–13+SR46892 (SR). D and E, bar graphs show the mean (±SEM) rate of clustering (D) and cluster duration (E) observed in the presence of NMDA alone (blue) or in the presence of NMDA and various drugs (grey bars, drugs indicated below each set). F, bar graphs show mean (±SEM) values of clustering rate, cluster duration and total number of action potentials (count) in the absence (blue) and presence of NT8−13 (grey) in cells whose voltage was adjusted to a value of −60 mV for both conditions. G, single unit recordings from MNCs in hypothalamic explants show the effects of stimulating the OVLT for 60 s at 10 Hz (STIM; arrows) in the absence (ACSF) and presence of NT8−13. H, bar graphs show the effect NT8−13 on mean (±SEM) rates of clustering induced by OVLT stimulation. *P < 0.05; **P < 0.01; ***P < 0.005; ns, not significant.
