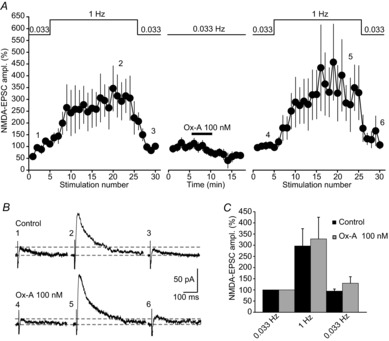
Figure 3. Ox-A leaves low-frequency facilitation of MF synapses unaltered.

A, mean time course of LFF of MF-NMDA-EPSCs (n = 5), evoked by increasing the stimulation frequency from 0.033 Hz to 1 Hz (indicated on top of the graph). Note that, although EPSCs show a gradual run-up during the initial 0.033 Hz stimulation, a strong, several-fold increase in EPSC amplitude occurred during the 20 pulses at 1 Hz that recovered after 0.033 Hz stimulation was resumed. After Ox-A (100 nm) application, NMDA-EPSC amplitude decreased, but LFF persisted. EPSC amplitudes before and in Ox-A were normalised to their respective baseline values at 0.033 Hz and set to 100%. B, raw traces (mean of 2 sweeps) corresponding to an experiment shown in A. Note that baseline NMDA-EPSCs were reduced in Ox-A, but LFF was fully developed. Numbers correspond to the time points in the graph shown in A. Horizontal lines refer to baseline holding current and peak NMDA-EPSC at 0.033 Hz. C, bar graphs summarising mean relative values of LFF in control (black bars) and in Ox-A (grey bars) (n = 5). The amplitude of LFF was obtained by dividing the mean EPSC amplitudes during the last 5 sweeps in the 1 Hz train by the mean of the 5 baseline sweeps. Relative values of LFF were not altered in Ox-A. Steady-state EPSC amplitudes at 0.033 Hz after the 1 Hz train are also indicated. Data are presented as mean ± SEM.
