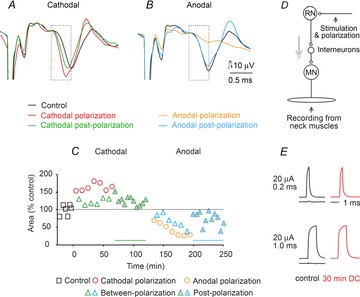
Figure 2. Effects of local polarization on EMG responses evoked by stimuli applied in the RN.

A and B, examples of EMG potentials recorded from neck muscles before, during and after cathodal or anodal polarization (1 μA) through the same electrodes via which a train of three 50 μA current pulses were applied to activate rubrospinal neurons. The illustrated records (averages of 20 single potentials) followed the third of these stimuli; the earlier parts of the records have been cropped off and the stimulus artefacts truncated. The records are aligned according to the onset of the stimulus artefacts (horizontally) and the onset of the EMG potentials (vertically). The dotted boxes indicate time windows during which their area was measured. C, time course of changes in the area of the EMG potentials expressed as a percentage of the area of control responses measured within time windows indicated by the dotted boxes in A and B. Continuous lines above the abscissa indicate the duration of the outlasting facilitatory and depressive effects. Significant differences were found when data from polarization, between-polarization and postpolarization groups were compared with control data. D, diagram of the stimulation and recording sites. The arrow indicates the direction of the neural traffic. E, comparison of constant-current 20 μA stimulus pulses delivered before (left) and during (right) passage of 0.2 μA cathodal direct current through a tungsten electrode (150 kΩ resistance against a reference electrode in Ringer solution). Current pulses were recorded 30 min from the beginning of application of the DC. When they were subtracted from each other, no differences or only marginal differences were found in the case of both 0.2 and 1.0 ms pulses; the longer-duration pulses were used to allow a better inspection of the shapes of these pulses. The difference traces are shown below control current pulses.
