
Figure 3. Effects of local polarization on indirect descending volleys evoked by stimuli applied in the RN in three rats.
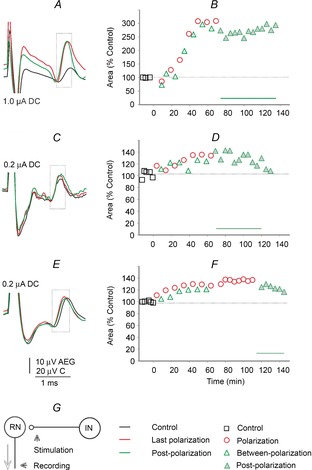
A, C and E, examples of indirect volleys recorded from the surface of the C2 segment before, during and after local cathodal polarization using 0.1, 0.2 and 0.2 μA direct current, respectively, through the same electrodes via which 30 μA double or triple current pulses were applied to activate rubrospinal neurons. Averages of 20 single potentials following the second of these stimuli are shown; the earlier and later parts of the records have been cropped off and the stimulus artefacts truncated. The records are aligned according to the onset of the stimulus artefacts (horizontally) and the positive peak of the descending volleys (vertically). The dotted boxes indicate time windows during which their area was measured. B, D and F, time course of changes in the area of volleys expressed as a percentage of the area of control volleys measured within time windows indicated by the dotted boxes. Significant differences were found for data from different periods for all comparisons in B, D and F. G, diagram of stimulation and recording sites