
Figure 1. Agonist and antagonist pharmacology of hECN GABAARs.
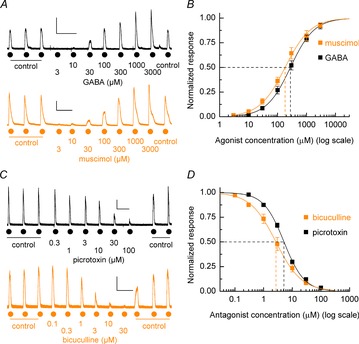
A, representative whole-cell current recordings of GABA and muscimol concentration–response experiments. Currents were elicited by increasing concentrations of bath applications of GABA and muscimol (3 μm to 3 mm) after establishing 3 control GABA-evoked currents as indicated. Calibration bars 250 pA, 100 s. B, mean agonist concentration–response curves for GABA and muscimol. Mean GABA data: EC50 = 278 ± 11 μm, nH = 1.05 ± 0.02, n = 12, N = 2. Mean muscimol data: EC50 = 182 ± 10 μm; nH = 0.99 ± 0.02; n = 6, N = 2. C, example currents illustrating the inhibition of GABA-evoked responses by increasing concentrations of picrotoxin (upper panel) and bicuculline (lower panel). Calibration bars 250 pA, 100 s. D, mean inhibition curves for picrotoxin and bicuculline antagonism of GABA (EC50) evoked currents. Mean bicuculline data: IC50 = 2.7 ± 0.2 μm; nH = 0.98 ± 0.03; n = 5, N = 2. Mean picrotoxin data: EC50 = 5.1 ± 0.2 μm; nH = 1.22 ± 0.03; n = 4, N = 2.