
Figure 2. Modulation of hECN GABAARs by diazepam, Zn2+ and gaboxadol.
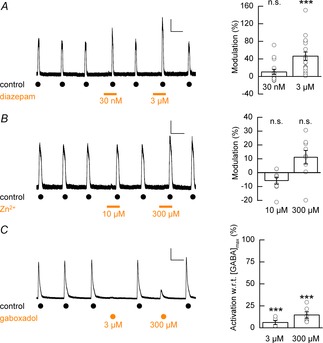
A, left panel: representative whole-cell recording depicting the co-application of diazepam (30 nm and 3 μm, as indicated by bars) to control GABA-evoked responses. A, right panel: modulation of GABAAR-mediated currents by diazepam (30 nm and 3 μm, n = 17, N = 3). Data are presented as mean percentage modulation with respect to control recordings. No difference was observed between percentage modulation and the batch from which cells were prepared. Calibration bar 50 pA, 50 s. B, left panel: example whole-cell recording depicting the co-application of Zn2+ (10 μm and 300 μm, as indicated by bars) to control GABA-evoked responses. B, right panel: mean percentage modulation of control GABAAR-mediated currents by Zn2+ (n = 9, N = 1). Calibration bar 100 pA, 50 s. C, left panel: example whole-cell recording of GABA (3 mm)-evoked currents and gaboxadol (3 μm and 300 μm)-induced currents. C, right panel: mean percentage gaboxadol-induced activation of GABAAR currents with respect to (w.r.t.) maximum GABA-evoked currents (n = 6–7, N = 1). Calibration bar 500 pA, 50 s.