
Figure 4. Death ensued following seizure-induced respiratory arrest.
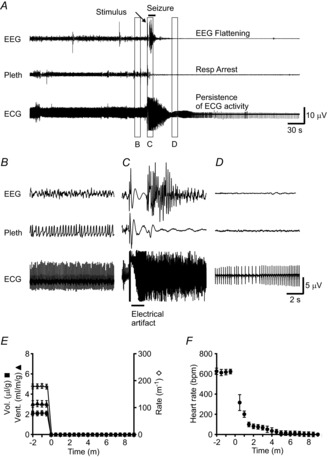
A, 5 min traces of EEG, breathing (pleth) and ECG from an animal that died following a seizure, demonstrating respiratory arrest beginning during seizure, flattening of EEG following seizure and prolonged persistence of ECG activity. The seizure was induced with MES (50 mA, 60 Hz, 200 ms). B–D, 10 s traces of EEG, breathing and ECG before (B), during (C) and after (D) seizure. Temporal position of data for B–D is indicated by the lettered boxes in A. E and F, graphs depicting tidal volume (Vol.), minute ventilation (Vent.), and respiratory rate (E) and heart rate (F) from 2 min before seizure to 9 min after seizure. Each data point represents the average during one 10 s epoch of data averaged for seven male mice. Error bars in E and F are ± SEM.