
Figure 5. Recovery of cortical activity in mice that survived seizures.
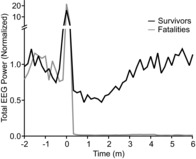
Graph depicting total EEG power between 0.5 and 20 Hz plotted versus time relative to seizure onset (time 0) in 10 s epochs. Fast Fourier power transform is plotted relative to 1 min of baseline EEG during wakefulness prior to seizure induction. Mean data are presented for four mice that survived (black) and seven mice that died (grey).