
Figure 4.
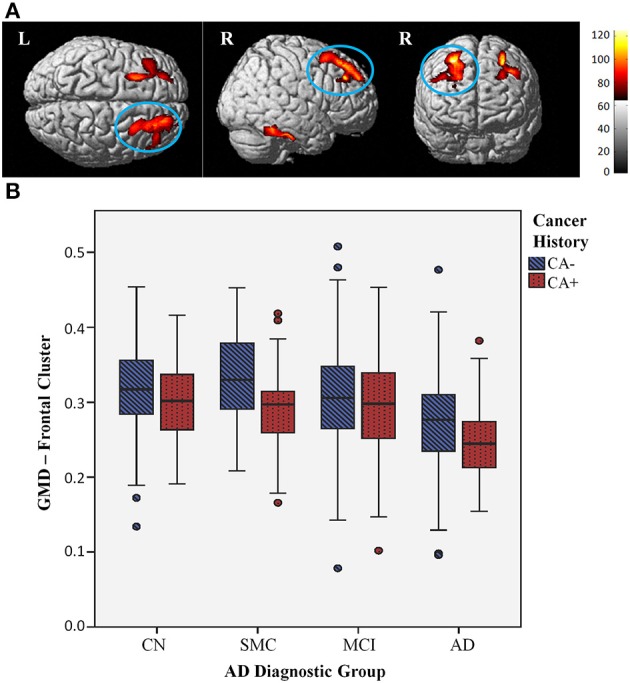
Lower gray matter density (GMD) with cancer history across diagnostic groups. (A) Surface rendering shows individuals with a history of cancer (CA+) display lower GMD than individuals without cancer history (CA−), across diagnostic groups, in the right superior frontal gyrus (cluster maximum MNI coordinates 28, 32, 54), shown circled (Punc < 0.001, cluster threshold Punc ≤ 0.1); this effect is observed to be bilateral at a more lenient threshold (Punc < 0.01, cluster threshold Punc ≤ 0.1), shown above. Colored areas indicate regions where CA+ gray matter density was less than CA− across groups at this threshold; red to yellow color scale indicates increasing statistical significance, with yellow areas indicating the most significant regions. (B) GMD values for right superior frontal gyrus cluster graphed by CA+ (red dotted bars) and CA− (blue striped bars) across AD diagnostic groups; CA+ have lower GMD across diagnostic groups.