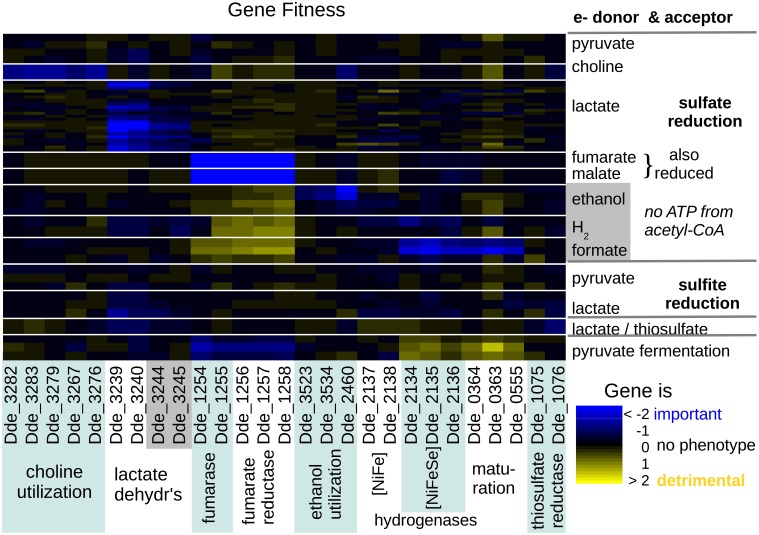
Figure 3.
Heatmap of fitness data for genes relating to the utilization of various electron donors or acceptors, across 12 energetic conditions. Along the x axis, the genes are grouped by biological process. Along the y axis, the experiments are grouped by electron acceptor and by electron donor. For combinations that were repeated, the height of each cell is reduced. Each cell's color shows whether that gene was important for fitness or detrimental to fitness in that condition. Within the sulfate reduction experiments, electron donors are sorted by the net ATP from substrate-level phosphorylation minus sulfate activation (only pyruvate yields net ATP). Experiments were done both with and without added yeast extract.

