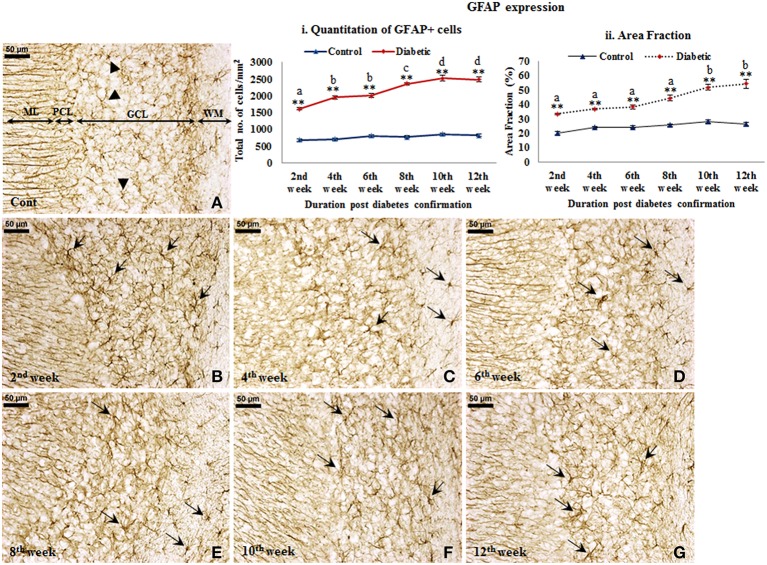
Figure 4.
Persistent astroglial activation following diabetes. GFAP immunolabeled light microscopic images of both diabetic and control cerebellum depicting profound astroglial activation during diabetes. Astroglial activation was consistent in white matter and in all the three layers of the cerebellum upto the 12th week of diabetic duration bearing thick, dense, wavy and fragmented processes with a darkly stained large cell body (B–G; arrows). In controls astroglia were presenting resting morphology having thin, fine processes and lightly stained small cell body (A; arrowheads). ML, Molecular layer; PCL, Purkinje cell layer; GCL, Granule cell layer; WM, White matter. Scale bar = 50 μm. Quantitation and area fraction graphs were showing a significantly increased population (i) and volumetric fraction (ii) of GFAP + cells in the diabetic cerebellum upto the 12 weeks post-diabetic confirmation in comparison to controls. Same alphabets on bars indicate non-significant differences between groups at the given time points (p ≤ 0.001). Value represents mean ± s.e.m. of the 30 readings/ animal/ time point. **p ≤ 0.001 for comparison of diabetic group with the respective controls.

